SAS 2024 Conference
announcement
conference
Society for Affective Science
Does Smile Synchrony Predict Working Alliance Quality in Psychotherapy?
Additional Figures Below
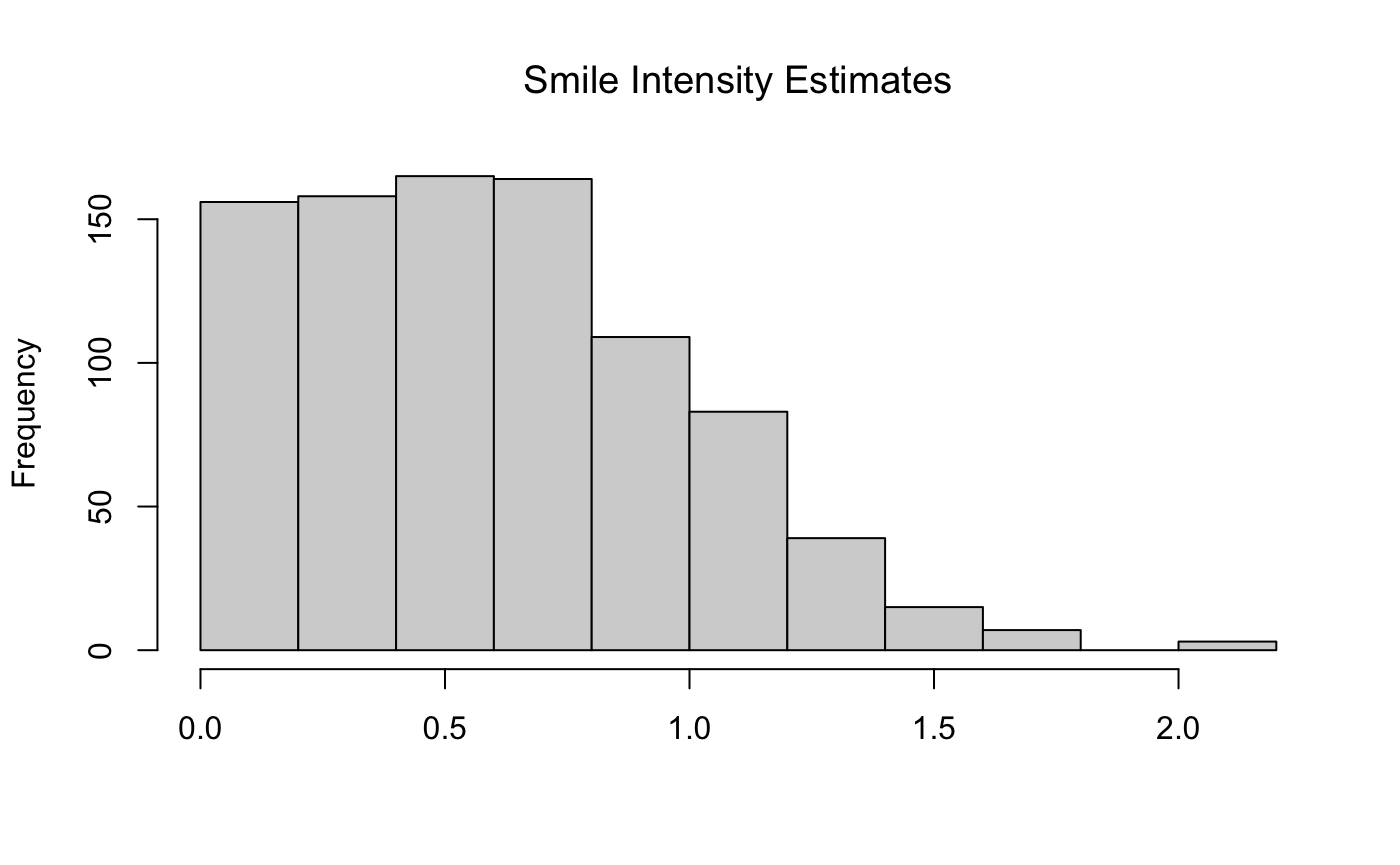
Histograms of Variables:

Figures including all sessions and patients (without clustering):
Show the code
data %>%
  ggplot(mapping = aes(x = fisher_z, y = wai)) +
  geom_point() +
  geom_smooth(method = "lm", se = FALSE, fullrange = TRUE) +
  labs(
    x = "Smile Synchrony",
    y = "Working Alliance Scores",
    title = "Working Alliance by Smile Synchrony"
  )
In this figure, each dot represents the relationship between working alliance scores and smile synchrony (including all sessions from patients)
Show the code
data %>%
  ggplot(mapping = aes(x = fisher_z, y = wai, colour = factor(patient_id))) +
  geom_point() +
  geom_smooth(mapping = aes(group = patient_id), method = "lm", se = FALSE, fullrange = TRUE) +
  labs(
    colour = "Patient ID",
    x = "Smile Synchrony",
    y = "Working Alliance Scores",
    title = "Working Alliance by Smile Synchrony"
    )
In this figure, each line represents the relationship between working alliance scores and smile synchrony for each patient. This figure includes data from all sessions.
Figures split by individual patients:
Show the code
data %>%
  group_by(patient_id) %>%
  ggplot(mapping = aes(x = fisher_z, y = wai)) +
  geom_point() +
  geom_smooth(mapping = aes(group = patient_id), method = "lm", se = FALSE, fullrange = TRUE) +
  labs(title = "Working Alliance by Smile Synchrony for each Patient",
       x = "Smile Synchrony",
       y = "Working Alliance Scores") +
  scale_x_continuous(breaks=seq(from=0.2,to=0.4,by=0.1)) +
  coord_cartesian(xlim = c(0.2, 0.4), ylim = c(0, 70)) +
  theme_gray(base_size = 12) +
  theme(plot.title = element_text(hjust = 0.5)) +
  facet_wrap(~patient_id, ncol = 8) +
  theme(panel.spacing = grid::unit(1, "lines"))
Each subfigure represents the relationship between working alliance scores and smile synchrony for each patient. This figure includes data from all sessions, but we have some missing data (e.g., patient #1025, patient #1072).
Show the code
data %>%
  group_by(session) %>%
  ggplot(mapping = aes(x = session, y = wai)) +
  coord_cartesian(ylim = c(20, 65)) +
  geom_point() +
  geom_smooth(mapping = aes(group = patient_id), method = "lm", se = FALSE, fullrange = TRUE) +
  labs(title = "Working Alliance Scores across Sessions",
       x = "Session",
       y = "Working Alliance Scores") +
  theme_gray(base_size = 12) +
  theme(plot.title = element_text(hjust = 0.5)) +
  facet_wrap(~patient_id)
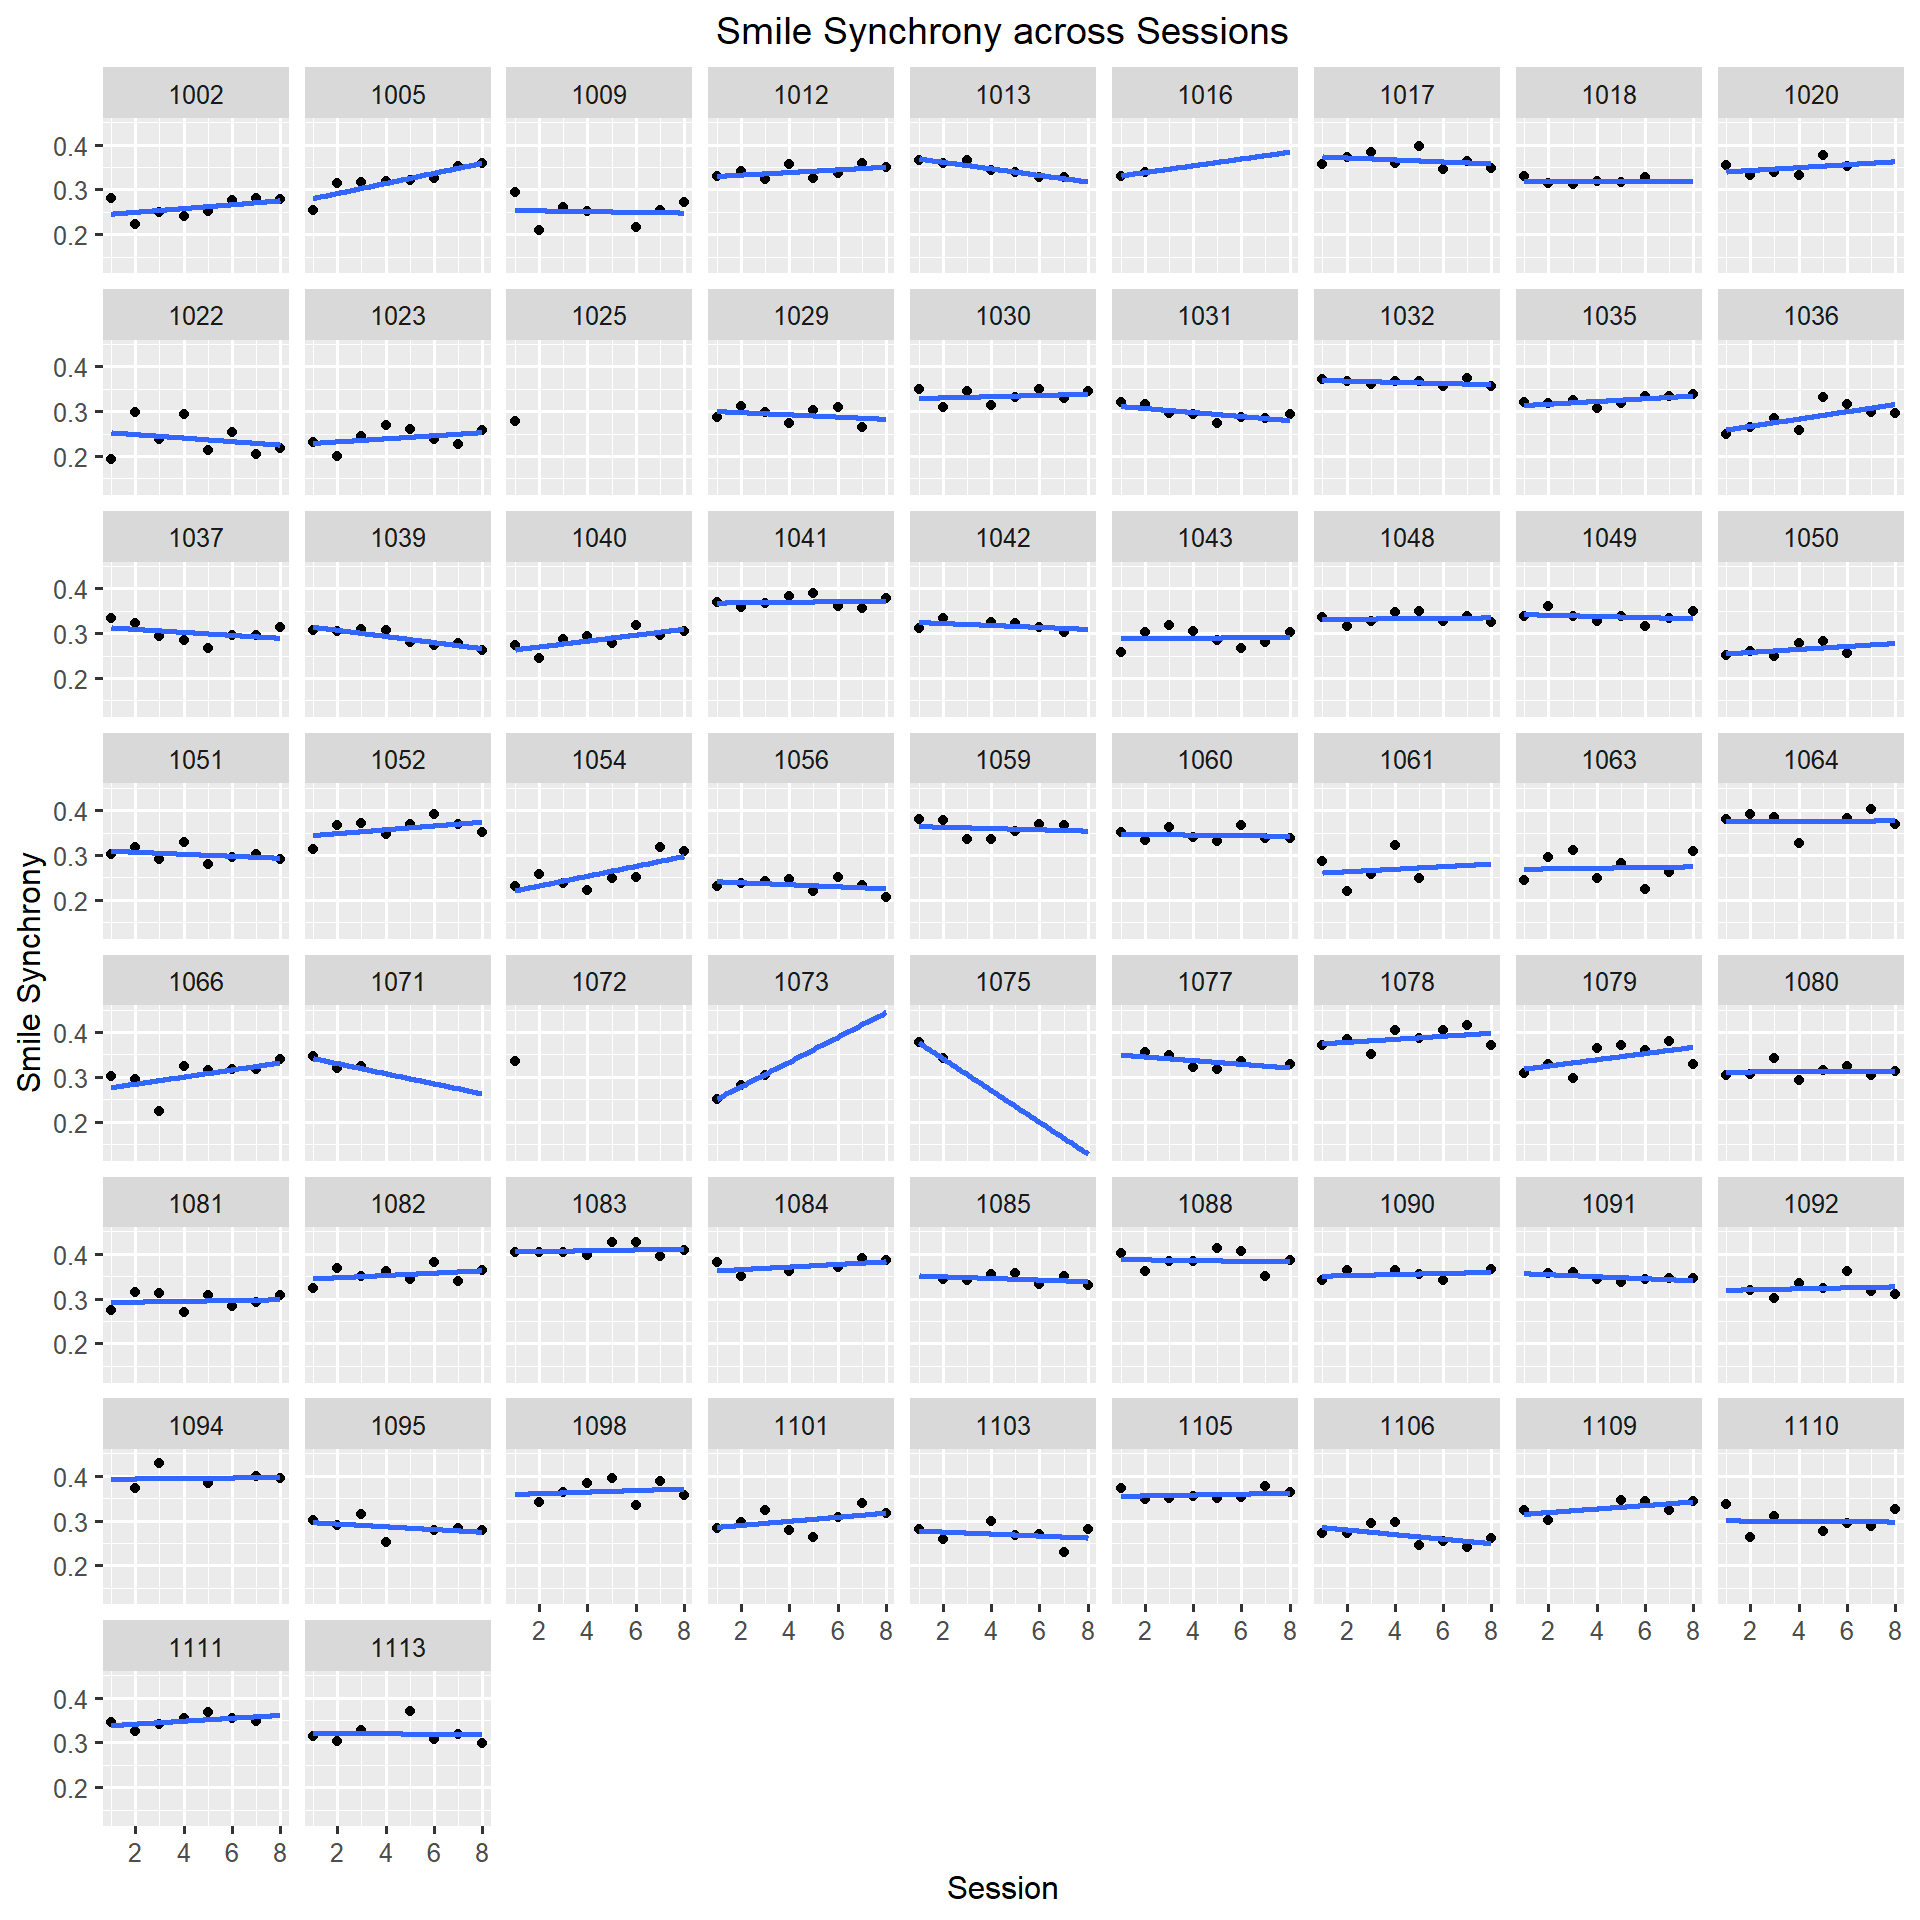
Show the code
data %>%
  group_by(session) %>%
  ggplot(mapping = aes(x = session, y = fisher_z)) +
  geom_point() +
  geom_smooth(mapping = aes(group = patient_id), method = "lm", se = FALSE, fullrange = TRUE) +
  labs(title = "Smile Synchrony across Sessions",
       x = "Session",
       y = "Smile Synchrony") +
  scale_y_continuous(breaks=seq(from=0.2,to=0.4,by=0.1)) +
  theme_gray(base_size = 12) +
  theme(plot.title = element_text(hjust = 0.5)) +
  facet_wrap(~patient_id)